I am of the opinion that Google is full of hype that has sent its share price beyond reasonable valuations. No question the growth story is good, but investor expectations go far beyond reality.
I have done a couple posts looking at Google and tried to demonstrate how this growth rate stuff for pricing investments is increasingly nonsense as the growth rate get higher. The example I used previously is:
| Daily rate
| Compounded rate
|
A
| 8% | 10,000,000,000% |
B
| 8.1% | 13,000,000,000% |
B minus A
| 0.1% | 3,000,000,000% |
C
| 0.0% | 0% |
D
| 0.1% | 27% |
D minus C
| 0.1%
| 27%
|
The difference in the rate being compounded each day of the year in the two examples is a mere o.1% difference yet with the high rate the magnitude of the difference at the end of 240 compounding periods is enormous, 3 billion percent versus just 27 percent. As the growth rate become large the numbers you get back a equally nonsense and this is the basis of the theory people have used in justifying Google's price because of "growth."
So, lets have a look at Google's eps:
Quarter
| Earnings/ share
| 1% increase over last Quarter
| 2Annualized Quarter Growth
| 3Annual Growth to Q4/04
|
Q4 2003
| 0.10 | n/a
| n/a
| n/a
|
Q1 2004
| 0.24 | 140%
| 3218%
| 3218%
|
Q2 2004
| 0.30 | 25%
| 144%
| 800%
|
Q3 2004
| 0.19 | -36.7%
| -83.9%
| 135%
|
Q4 2004
| 0.71 | 274%
| 19400%
| 610%
|
Q1 2005
| 1.29 | 81.7%
| 990%
| 674%
|
Q2 2005
| 1.19
| -7.8%
| -27.6%
| 421%
|
Q3 2005
| 1.32
| 10.9%
| 51%
| 337%
|
Q4 2005
| 1.22
| -7.6%
| -27%
| 249%
|
Q1 2006
| 1.95
| 59.8%
| 553%
| 274%
|
Q2 2006
| 2.33
| 19.5%
| 104%
| 252%
|
Q3 2006
| 2.36
| 1.3%
| 5.3%
| 216%
|
Q4 2006
| 3.29
| 39.4%
| 278%
| 220%
|
Q1 2007
| 3.18
| -3.3%
| -12.7%
| 190%
|
Q2 2007
| 2.93
| -7.9%
| -27.9%
| 163%
|
Q3 2007
| 3.38
| 15.4%
| 77.1%
| 156%
|
Q4 2007
| 3.79
| 12.1%
| 58.1%
| 148%
|
1This is a quarterly rate of return (loss). 2The rate must be taken to the 4th power to get the annualized rate. 3This is what the annualized rate of return is if it was constant back to Q4 2003.
The rate of growth is clearly declining, as this graph shows.
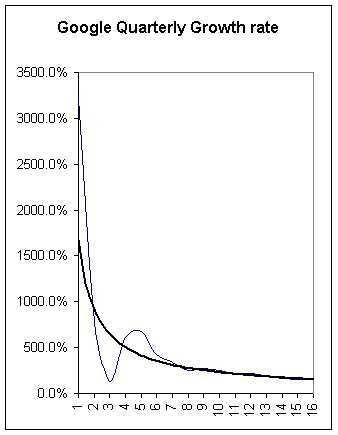
The rate of growth in the chart looks enormous, but that is partly because it is being compared back to when eps was 10c. The bolder second line is a smoothed trend line. The growth rate in earnings over time has been declining rapidly.
If the growth rate per year is looked at, you get less overall volatility as "events" are averaged in over a year rather than a quarter.
Year
| Earnings
| Percent Growth
|
2003
| 0.41 |
|
2004
| 1.46 | 256% |
2005
| 5.02 | 244% |
2006
| 9.94 | 98% |
2007
| 13.29 | 33.7% |
The increase in earnings last year was $3.35, the year before was $4.92 and the year before $3.56. The absolute earnings growth for 2007 has been less than both 2006 and 2005. If you were to assume the same rate of growth for next year, according to PEG theory $13.29*33.7 gives $448 as a fair price. It means that the earnings per share needs to increase to $17.77 or $4.48/share for 2008. Given that the earnings growth has only increased that much one year, it is a tall order.
The other thing that makes Google a bad investment, imho, is the gross level of stock based compensations. Within their expenses they have $1.6 billion of stock based compensation, or 38% of the 2007 earnings. They've increased their employment numbers by 57% over the past year. If I take the average of 2006 and 2007 number of employees, I get 13740 employee for the average for the year. Averaging the stock based compensation over the number of employees comes to a whopping $116k per employee, more than 3 times the starting salary for a teacher in BC, I might add. They are returning an enormous amount of
Another way to put this into perspective, it is $5.06 per share. Heck, that kind of stock based compensation can completely obliterate the true growth rate.
Interesting, when I add up the stock based compensation figures from their consolidated statement of income, I get $1.6 billion, but when I read it on their website it gives $869 million. From their website stock based compensation more than doubled from 2005 to 2006 and then almost doubled again in 2007. Employee increases are considerably less than the stock based compensation.
The fully diluted number of shares has gone from 273 million at the end of 2004 to 318 million at the end of 2007, or a growth rate of 5.2% over the 3 years.


1 comment :
this is hot
zee
Post a Comment