I've been reading some of Jim Jubak's writings and I appreciate his pieces for their deeper understand and broader look at how the world has been changing.
His piece, Why these good times feel so bad, gave me a lot to think about.
In particular what got my attention was the "The churn in employment,"
My Dad, to take an extreme example but one shared by many in his generation, worked for the same employer all his life, from his start at 17 as a sweeper on the factory floor to his retirement at 62 as a maintenance electrician. For him, except for his service in World War II, the churn didn't exist. It was something that happened to other guys. Until the last few years of his working life, when the company began to talk about shutting down the plant where he worked, as far as I can remember, he never worried about losing his job and having to find another one.Contrast his experience with the churn experienced by the generation of workers born between 1957 and 1964. Unlike my Dad, born in 1917, these workers held an average of 10.5 jobs between the ages of 18 and 40, according to a study by the Bureau of Labor Statistics. In those 22 years of work, 21% of workers in the study, which ran through 2004, held 15 or more jobs. Only 15% held fewer than four jobs in that period.
Being a part of the born between 1957 and 1964 I can relate to the "job churn." On the surface the new reads that people change careers more often today and there is no insight into the unrest and lack of satisfaction in people's lives that are leading to these changes.
When I look back the truth is I'd have done better economically for myself if I'd stayed at my job as a waitress at White Spot that I got when I was 15 in 1977. Minimum wage for a 15-year-old was $2.60/hour and my rate of union pay was $3.92 and I got tips on top of it, making the wage about $6-7/hour, 30 years ago.
What 15-year-olds today can expect? In BC they get $6/hour for their first 500 hours of work, and then they go to $8/hour. With just 2% inflation $6/hour 20 years ago would be $10.87 today. If you look at what young people spend their money on, like university tuition, well, I remember paying $18/credit hour in 1980 and today it is $151.70, so 2% increase on $6/hour to 1980 would be $6.50 and to increase that buying so that young people have the same buying power to pay for post secondary education would give a wage of $54.73/hour.
I just saw Linda Blair's head in the "Exorcist" just twist around 3 times at the idea that my buying power as a 15-year-old waitress to improve my life's prospects was in the range of what, what an reasonably well paid engineer gets paid today.
When I worked in the restaurant industry tipping was not automatic and there was not the strong social expectation for tipping that exists today. My tips worked out to about 5% of total sales. I'd say a good 1/3rd of customers did not leave tips and it was rare to get a tip over 10%. I was doing about 20% better than my co-workers on tips. I was very good and if you were a regular customer of mine and I knew what you liked, well, I had your coffee poured and your order written before your seat hit the chair. I got tips out of customers known to never leave tips.
I don't know the base rate of pay at White Spot today, but a quick check of the menu and prices shows that the $2 hamburger platter now costs $10. So, I would suspect social pressure has increased tipping so that it is more like 10% of the sales and with 500% increase in prices, that would make tips come to $20-30/hour, and most certainly restaurant works are not claiming and paying taxes on 100% of their income like those of us with 100% of our income going through a payroll.
Waiting tables, politician and corporate executive or high level management are the few occupations that come to my mind that have exceeded reported inflation in terms of income growth over the past 30 years. A hamburger platter increased from $2 to $10 over 30 years is an average price increase of 5.5% per year. Just looking at the goods I sold, to be able to afford them as well as I could as a teenage worker I'd need to earn $30-35/hour. Had I stayed with my White Spot job I'd be making about $30-40/hour with tips and because of not paying full tax, my buying power would likely be that of a worker making $35-50/hour.
What did I do instead? I went a "better" job with a "future" in banking, which immediately paid less, but the promise was that there was supposed to be "opportunity." So much for opportunity when I just so happened to get into banking right before ATMs were invented and as the economy slipped into a recession. I lost work and I found it difficult finding new work. I won a job competition in which about 60 applications were made for a low entry level position and the pay was less than I had been making.
In two of my banking jobs I had alcoholic bosses. My view is that many of the limited jobs that were available were because the working conditions were disgusting and despite an exceptionally tight economy, they had enormous job turnover because of the unsavory working conditions.
The one small credit union I worked in with that abusive alcoholic boss had an annual turn over of more than 100% of the staff and I survived 18 months in the place, training new employees on average every three months, before I'd had enough run ins with with the alcoholic pig. And then I ended up a job with another alcoholic boss. During this period of what I see as enormous turmoil in the labour market both of these alcoholic men lost their jobs within a year of my moving on and to my knowledge neither returned to the workforce. One was about 60, but the other was only in his 30s and last I heard he was in his 50s and had not worked again. I perceive that many alcoholics were successfully integrated into the economy prior to the 1980s, but when the economy got tight, many were displaced, but not before they left an enormously sour taste in those that were employed below them.
I'd say the 80s brought in an era where good workers were overlook through no fault of their own and it was the end of the era of dead weight workers thriving. The news featured layoffs daily, and less experienced workers were pit against a glut of more experienced workers for not enough jobs to go around. The news featured the woes of the $50k per year 50-year-old workers being replaced with younger workers willing to work for $30k and the media bite was that "older workers are being discriminated against," when the truth was that wages for the work they had been performing had imploded. They'd have been working had they been willing to work for the same pay as younger workers.
What I know about my salary working in the banking industry, and having a window on everyone else's pay cheque, is that my wage relative to many occupations was low, with the exception of the retail industry. I was making about $7/hour in 1984 and union jobs paid about double. Some union jobs, like being a checkout clerk at Safeway, paid $17/hour.
I believe the extreme inequities in pay is what ultimately broke the union. Minimum wage was $5/hour at the time and you'd have had a line a mile long of workers, including me, willing to work for $10/hour.
And then, when I look at my mother passing away and the bank foreclosing on her home and eating all capital in her estate the inequity screams. The mortgage was $26,000, and the total payments came to around $300/month. Seriously, if I'd dropped out of high school and worked full-time with an income of $1000-1200/month and the ultra low tax environment of the day, I could have afforded the payments, and with a protected rising income due to tips, it would have simply gotten easier each year, and I had an extra bedroom I could have rented. Indeed, I could have afforded to make extra payments.
I just did a search on two bedroom apartment in Kitsilano, 30 years or older. The cheapest that came up is $449,000 for 717 sq ft. Assume I had that 25% down, the mortgage would be $337k and I'd need a qualifying income of $101,000. With 5% down I'd need a qualifying income of $129,000. Just where does one find a job with that kind of pay today? Beginning teachers start at about $42k, and that's with taking 6 years out of their working lives and taking on student loan debt that averages $40-50k.
I had an excellent grasp of math and budgeting as a teenager. Indeed, I was supporting myself at 17 and my first "major" life purchase wasn't a stereo or any of the things you associate with youth, but it was a washing machine. I'd calculated that it was costing me $10/week for taxi and washing machines at the laundromat and I could buy a washing machine for about $400. In less than a year it would be paid for with saving from having to take a taxi and paying the high prices charged to clean clothes.
When I go back an look at the "Churn in Employment," well, no wonder people people in my age group have been changing jobs. The rate of decline in buying power has been enormous, at least where I live.
And I went to university after having series of unsatisfactory jobs in the banking industry. I came out to triple the price of housing and no jobs. I had a friend who had a 2 year technical program that had made $36k in 78. Three years ago I applied for a job with greater qualifications and that was about the pay they wanted to start at. In 78' my friend's wage exceeded was about 150% of my mom's mortgage amount. Today that wage would be about 10% of the mortgage.
I feel like my generation just missed the boat. It is no wonder I see so many professionally educated in this age group in Vancouver no longer making ends meet.
But, you have to ask, will there ever be a boat for the younger generation?
How many violated "truths" can be counted here?
1) Waitressing is a dead end job. Just what is dead end? Seems to me having economic stability gives a heck of a lot more prospects then doing the "right" thing and going to university and giving up six year of income and finding absolutely zero prospects of even coming close to the same standard of living that being high school drop out would have given.
2) You always do better by getting an education. Sure, and today they come out with $40-50k of student loans and job prospects that leave them in a student loan debt ration comparable to the mortgage debt ratio of years prior. Our university educated come out with a rock to tread that is so big, they are truly lucky if they don't drown, and if you actually open your eyes, you'll see that a great many of them are in fact economically drowning. And here's the biggest joke going, the baby boom expect them to pay their pensions and health care. I can't wait to see that one play out.
Seriously, it is time the gross inequities in the distribution of wealth start to show a little equity. The only thing that can come out of this is a perilous resentment towards age, and if nothing is done to correct it will indeed be well earned, as will the consequences.
One thing I'd have to say that I am truly tired of hearing is how irresponsible younger groups are for not getting their act together and living with in their means. I'd like to see how well the judge and jury mouth pieces that never had to navigate the economic disaster facing youth would have done.
Read More......


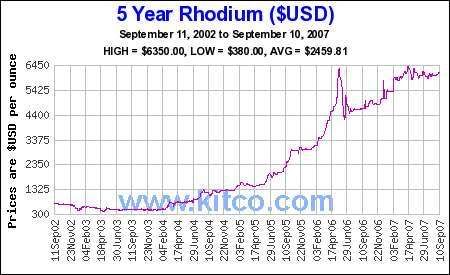
![[Most Recent Quotes from www.kitco.com]](http://www.kitconet.com/charts/metals/base/spot-aluminum-5y.gif)
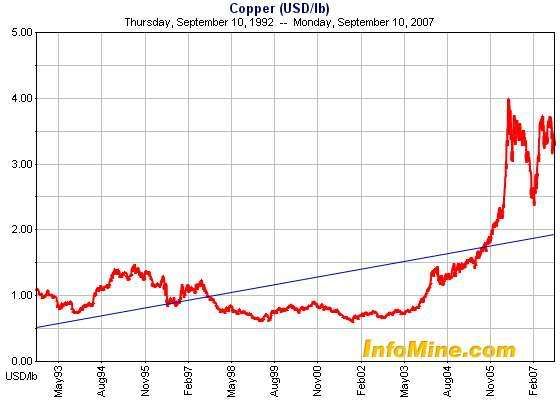
![[Most Recent Quotes from www.kitco.com]](http://www.kitconet.com/charts/metals/base/spot-copper-5y.gif)
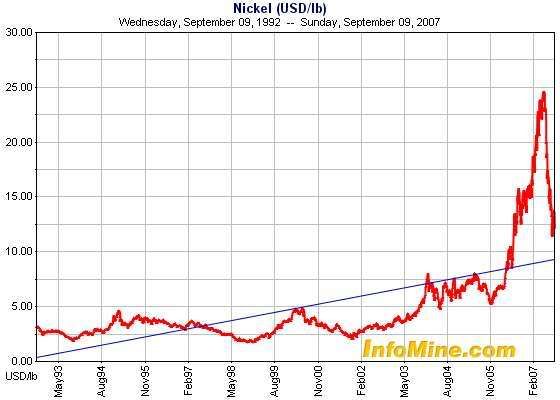
![[Most Recent Quotes from www.kitco.com]](http://www.kitconet.com/charts/metals/base/spot-nickel-5y.gif)